Combined Ad Performance Overview
Total Spend
$2,656
Google + Meta
Total Clicks
708
Total Impressions
128,793
Total Leads
87
52 Google + 35 Meta
Purchases
5
Meta Ads
Phone Calls
52
Google Ads
Google Ads Performance
Google AdsSpend
$1,960.10
Clicks
258
Impressions
108,598
Leads
52
CTR
0.24%
CPC
$7.60
CPL
$37.69
CPM
$18.05
Sin City Diabetics V3
| Campaign | Spend | Clicks | Impr. | Leads | CPC | CPA | CTR |
|---|---|---|---|---|---|---|---|
| Local PMAX General | $1,608.95 | 186 | 88,695 | 33 | $8.65 | $48.76 | 0.21% |
| Local PMAX Expanded Locations | $297.85 | 56 | 13,964 | 15 | $5.32 | $19.86 | 0.40% |
| Local PMAX General | Wed & Thurs | $11.61 | 5 | 4,775 | 4 | $2.32 | $2.90 | 0.10% |
| Total (V3) | $1,918.42 | 247 | 107,434 | 52 | $7.77 | $36.89 | 0.23% |
Sin City Diabetics V2
| Campaign | Spend | Clicks | Impr. | Leads | CPC | CPA | CTR |
|---|---|---|---|---|---|---|---|
| PMAX | Website Traffic | $41.68 | 11 | 1,164 | 0 | $3.79 | — | 0.95% |
| Total (V2) | $41.68 | 11 | 1,164 | 0 | $3.79 | — | 0.95% |
Meta Ads Performance
Spend
$696.02
Clicks
450
Impressions
20,195
Leads
35
Purchases
5
CTR
2.23%
CPC
$1.55
CPA
$17.40
Reach
13,029
| Campaign | Spend | Clicks | Impr. | Leads | Purchases | CPC | CPA | CTR |
|---|---|---|---|---|---|---|---|---|
| Lead Campaign | Sales vs Informative | Top 14 States | $627.41 | 247 | 14,150 | 35 | 5 | $2.54 | $15.69 | 1.75% |
| Local Traffic | Dynamic | $68.61 | 203 | 6,045 | 0 | 0 | $0.34 | — | 3.36% |
| Total | $696.02 | 450 | 20,195 | 35 | 5 | $1.55 | $17.40 | 2.23% |
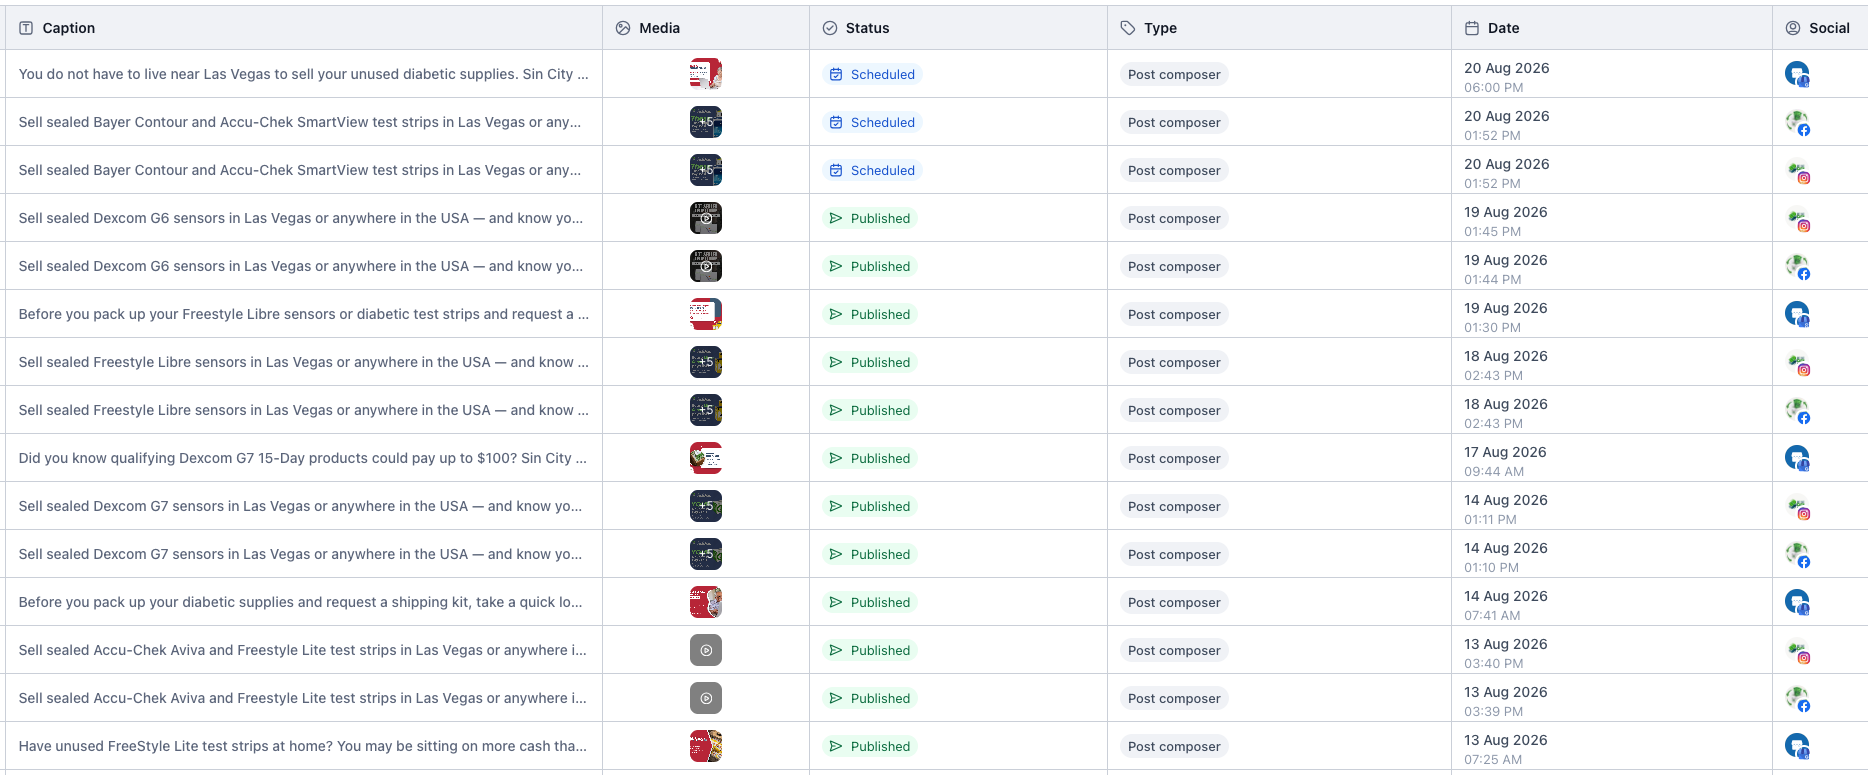
Social Media Planner
Facebook
Instagram